Comparing the gridded estimates to the observations
The EWEDB holds daily gridded data we downloaded from BoM. The size of this data collection is formidable (> 71,000 raster grids currently with 1980 to present, and set to grow significantly as we incoporate earlier decades).
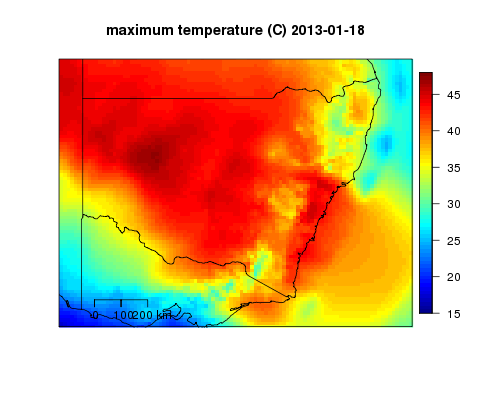
We were faced with the choice to store data for more time points (days), at lower spatial resolution (less megabytes) or for less time points at higher spatial resolution (more megabytes). In the interest of deriving Extreme Weather Indices from the longest timeframe possible (to identify truly extreme observations from the full historical range) we decided to aggregate the original data from 5km pixels to 15kms squared pixels. This loss of spatial precision is compensated to some extent by the high spatial autocorrelation as displayed in the map of the recent heatwave in New South Wales, Australia, January 2013.
When we aggregate pixels of the grid there is more chance that the observed data will be different from the estimate at that location due to spatial smoothing. In this post we will compare the observations from BoM weather stations with the daily values for the grid cell they intersect.
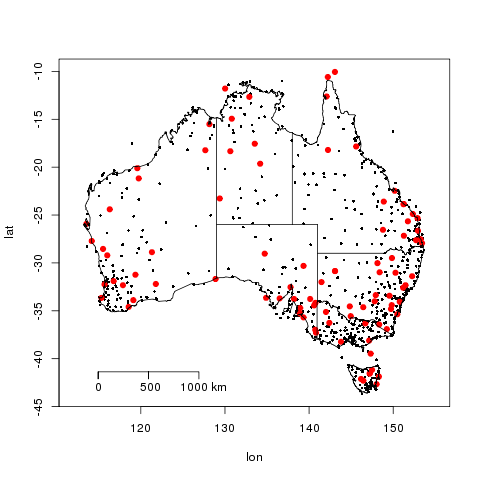
There are 939 weather stations that have valid observations for all three temperature, vapour pressure (humidity) and rainfall in the 1990-2010 period we also hold the data for. To save a bit of time we’ll only do a 10 percent random sample (93) of these shown below.
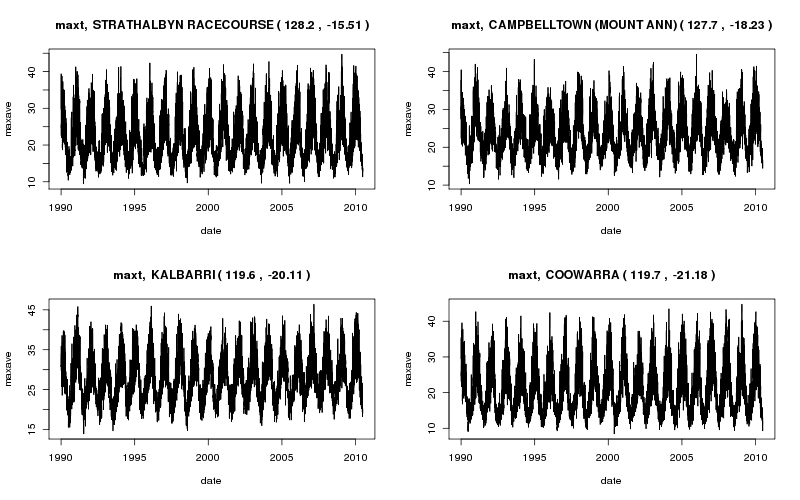
Getting the values for each station from the grid pixel it lies on we can construct an artifical timeseries as shown.
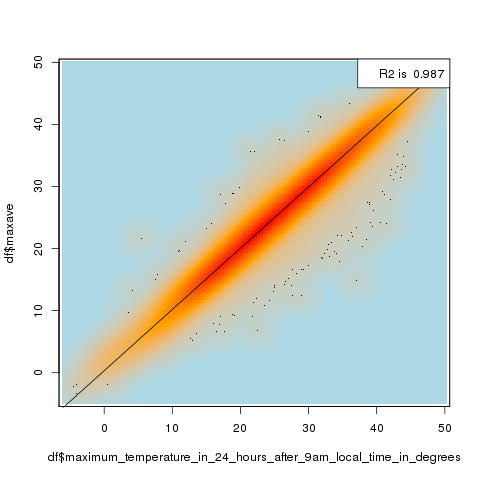
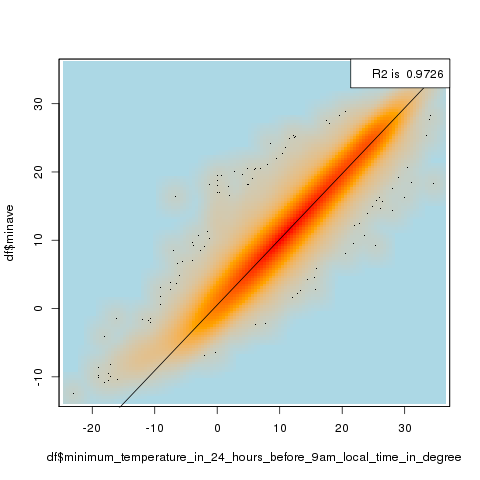
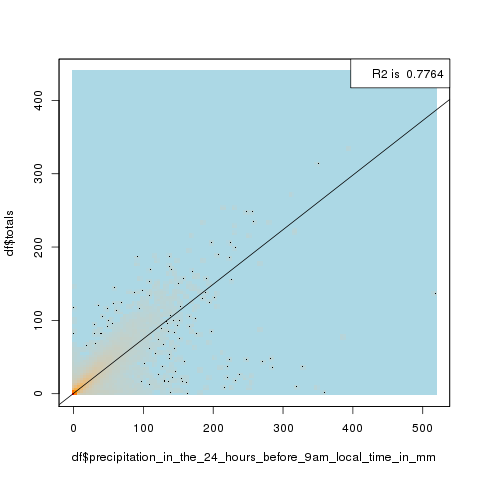
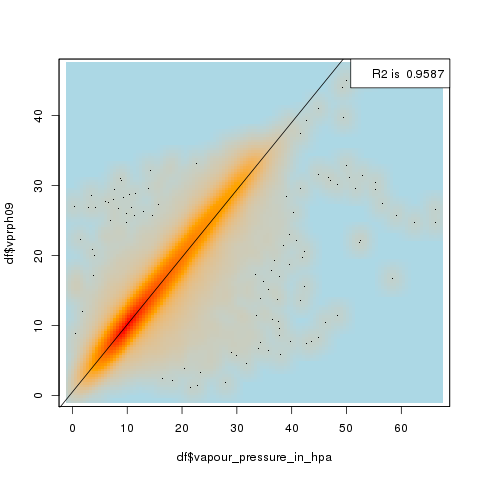
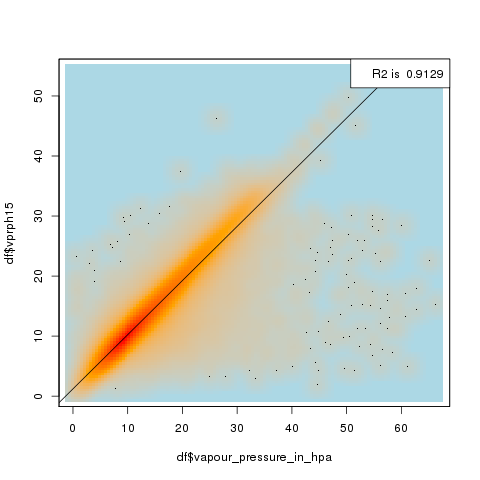
Merging these estimates with the observed data we can compare them and derive some summary statistics such as the R-squared.
Max Temp
Min Temp
Rainfall
Vapour Pressure (humidity) 9am
Vapour Pressure (humidity) 3pm
Conclusions
The comparison presented here shows that the observations and AWAP gridded datasets that we have processed for storage in the EWEDB differ, due to the spatial smoothing that has occured in the processing undertaken for the EWEDB project.
Users are asked to bear this in mind when considering the appropriateness of these data for their specific application.
