Extracting the weather for each location that a farm dog was observed
These data were collected by Linda Van Bommel and supplied to the SWISH project by Luciana Porfirio to use as a demonstration of how our tools might be used by researchers in other disciplines.
The locations are taken from radio tracking collars on farm dogs taken over 8 months, all in the same format (date, time, lat, lon) for a number of dogs. The coordinates are from a farm in Victoria.
Step one: modify the SWISH example
The previously written workflow used as a test case for the SWISH project was downloaded from this web page.
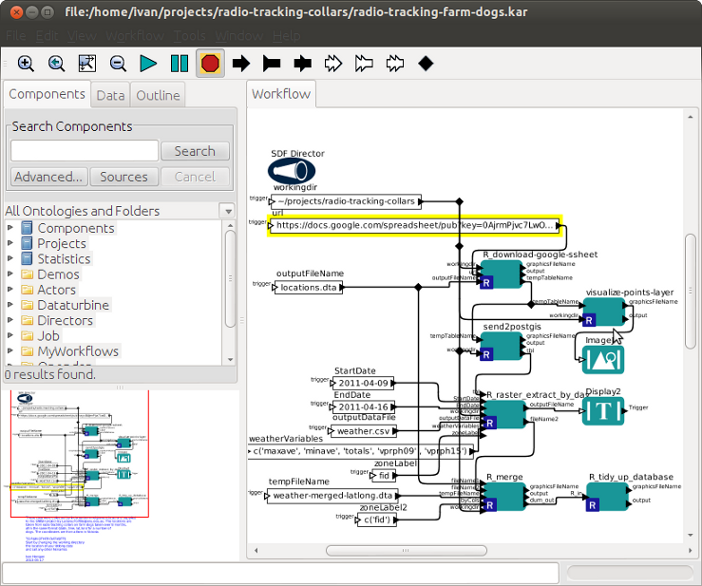
That workflow takes location names with unknown lat, longs and geocodes them using the GoogleMaps API. For this dataset we do know the lat, longs so the first step was to delete the superflous actor and replace it with one that gets the data from the source location at Google Docs/Spreadsheets.
This URL is highlighted in the image below.
Step two: Add some specific code to this analysis
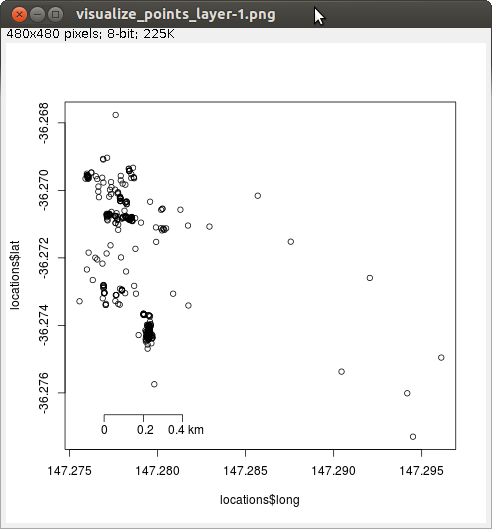
For example we will want to look at the spatial distribution of these data so a simple map is generated and displayed in the imageJ actor. When the workflow is run the image below appears in a new window. This can then be refined into a publication quality map at a later time.
Step three: specify the dates required
The information required by the “R raster extract by day” actor needs to be changed to reflect the specific duration of this dataset.
Step four: include a new step to merge the output time-series data with the spatial data
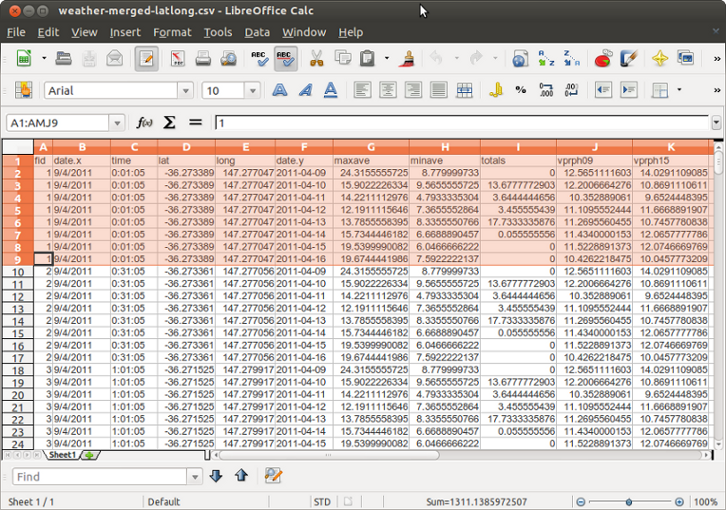
The time series data is then extracted for each location, and every time point. That output does not include the lat,long data so this is merged by adding the “R merge” actor and specifying the files to merge. The result is shown below:
Step 5: assess data
In the above image we see that date.x is the date of the observation, date.y is the time the weather value was observed at that lat,long. For each location we now have the complete timeseries of weather data extracted from the EWEDB AWAP grids datastore.
Future work required: reformating data
As you can see this is almost what we want, but not quite. We now know the weather on each day for every location the dog visited. However what we really want will be the weather at the point the dog was at the same time the dog was there. To do this additional actors can be added to take the data generated so far and perform subsequent re-formatting steps so the data do match up the observations with the weather at their exact time point.
Automated processing of multiple datasets
Once the workflow is finalised the URL pointing at the Google Spreadsheets dataset can be changed to other farms, or indeed any datasets with lat, long values in Australia. If there is a large number of these a list of URLs could be fed into the workflow in a loop so that each dataset is processed in exactly the same way. In this manner many datasets can be accessed in a rigorous and transparent manner, and revisions can be easily incorporated as new datasets are aquired or new analysis plans are formulated.
Replication data and software
The data and software used in this tutorial are available from these links:
